Being meaning to write something up about the recent PSOD party I had at one of my clients site, just some background information:
- 3 clusters of 32 hosts
- all connected to the same storage arrays (different LUNs obviously)
- all the same blade and ESXi version
- all the same firmware for all components
- had been running stable for well over 18 months
This environment all of a sudden started experiencing PSOD errors, there were 2 different ones that would appear these are:
no heartbeat (2/2 IPIs recieved)
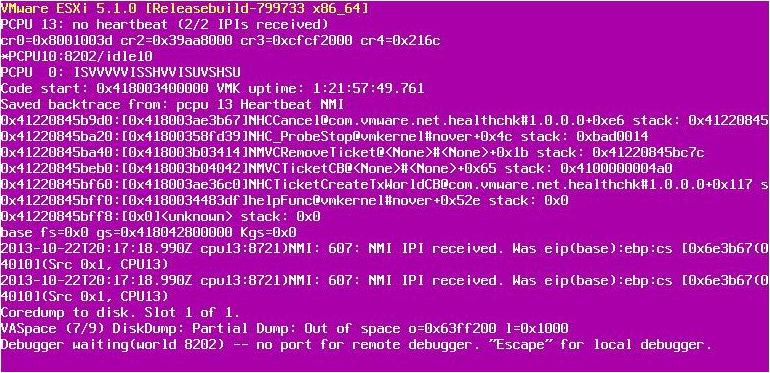
Exception 14 I could not find the screenshot I took but the exception 14 was only happening sometimes and I think it was more a flow on effect from the above psod when virtuals HA accross in such a volume. But was still part of the whole puzzle.
This was effecting what appeared to be random hosts in all 3 clusters, so natually I looked at storage and in the VMkernal log and in the vCenter events I was noticing storage was being lost just prior to the PSOD.
2013-11-12T14:56:46.081Z cpu13:8341)WARNING: vmw_psp_rr: psp_rrSelectPathToActivate:1049:Could not select path for device "naa.6006016027402b0048cc26b7ffece211".
 2013-11-12T14:56:46.111Z cpu0:8339)WARNING: vmw_psp_rr: psp_rrSelectPathToActivate:1049:Could not select path for device "naa.6006016027402b0048b1ef93feece211".
 2013-11-12T14:56:46.121Z cpu9:8336)WARNING: vmw_psp_rr: psp_rrSelectPathToActivate:1049:Could not select path for device "naa.6006016027402b00eca593aafeece211".
 2013-11-12T14:57:01.331Z cpu13:8601)BC: 3115: Blocking due to no free buffers. nDirty = 111 nWaiters = 1
 2013-11-12T15:01:01.613Z cpu13:201200)LinBlock: LinuxBlockCompleteCommand:857: This message has repeated 896 times: Command 0x9e (0x412403fc1f80) failed H:0x0 D:0x2
 2013-11-12T15:01:41.207Z cpu4:8601)BC: 3115: Blocking due to no free buffers. nDirty = 26 nWaiters = 1
 2013-11-12T15:01:46.103Z cpu8:8342)WARNING: vmw_psp_rr: psp_rrSelectPathToActivate:1049:Could not select path for device "naa.6006016027402b0048cc26b7ffece211".
 2013-11-12T15:01:46.183Z cpu6:8337)WARNING: vmw_psp_rr: psp_rrSelectPathToActivate:1049:Could not select path for device "naa.6006016027402b0048b1ef93feece211".
 2013-11-12T15:01:46.201Z cpu11:8342)WARNING: vmw_psp_rr: psp_rrSelectPathToActivate:1049:Could not select path for device "naa.6006016027402b00eca593aafeece211".
 2013-11-12T15:02:11.501Z cpu4:20421)WARNING: ScsiDeviceIO: 1211: Device naa.6006016027402b000cbdccfc4c09e311 performance has deteriorated. I/O latency increased from average value of 3457 microseconds to 89031 microseconds.
 2013-11-12T15:02:13.439Z cpu5:20421)WARNING: ScsiDeviceIO: 1211: Device naa.6006016027402b000cbdccfc4c09e311 performance has deteriorated. I/O latency increased from average value of 3457 microseconds to 180002 microseconds.
 2013-11-12T15:02:17.954Z cpu3:20424)WARNING: ScsiDeviceIO: 1211: Device naa.60060160f192280016a44f415d09e311 performance has deteriorated. I/O latency increased from average value of 1622 microseconds to 33289 microseconds.
 2013-11-12T15:02:22.819Z cpu6:12454)WARNING: ScsiDeviceIO: 1211: Device naa.6006016027402b0072fbde1d4d09e311 performance has deteriorated. I/O latency increased from average value of 4131 microseconds to 97157 microseconds.
 2013-11-12T15:02:25.997Z cpu11:20423)WARNING: ScsiDeviceIO: 1211: Device naa.6006016027402b0072fbde1d4d09e311 performance has deteriorated. I/O latency increased from average value of 4186 microseconds to 205924 microseconds.
 2013-11-12T15:02:30.516Z cpu1:149953)WARNING: ScsiDeviceIO: 1211: Device naa.60060160f1922800f472c1e2c80ae311 performance has deteriorated. I/O latency increased from average value of 1852 microseconds to 39664 microseconds.
 2013-11-12T15:02:33.835Z cpu5:199435)WARNING: ScsiDeviceIO: 1211: Device naa.60060160f192280086d94d9c2950e011 performance has deteriorated. I/O latency increased from average value of 2141 microseconds to 43118 microseconds.
 2013-11-12T15:02:39.336Z cpu12:17406)WARNING: ScsiDeviceIO: 1211: Device naa.60060160f192280086d94d9c2950e011 performance has deteriorated. I/O latency increased from average value of 2178 microseconds to 64871 microseconds.
 2013-11-12T15:02:47.362Z cpu15:30726)WARNING: ScsiDeviceIO: 1211: Device naa.60060160f19228000ae292e0290ae311 performance has deteriorated. I/O latency increased from average value of 2883 microseconds to 57746 microseconds.
 2013-11-12T15:02:48.123Z cpu13:170719)WARNING: ScsiDeviceIO: 1211: Device naa.6006016027402b00962c4b8a4c09e311 performance has deteriorated. I/O latency increased from average value of 6956 microseconds to 140386 microseconds.
 2013-11-12T15:02:48.332Z cpu12:149945)WARNING: ScsiDeviceIO: 1211: Device naa.60060160f19228000ae292e0290ae311 performance has deteriorated. I/O latency increased from average value of 2902 microseconds to 65330 microseconds.
 2013-11-12T15:02:53.705Z cpu7:170719)WARNING: ScsiDeviceIO: 1211: Device naa.6006016027402b00a2a891b43f09e311 performance has deteriorated. I/O latency increased from average value of 6750 microseconds to 141773 microseconds.
 2013-11-12T15:02:53.801Z cpu8:168056)WARNING: ScsiDeviceIO: 1211: Device naa.6006016027402b0072fbde1d4d09e311 performance has deteriorated. I/O latency increased from average value of 4230 microseconds to 433102 microseconds.
 2013-11-12T15:02:56.613Z cpu11:14711)WARNING: ScsiDeviceIO: 1211: Device naa.6006016027402b00962c4b8a4c09e311 performance has deteriorated. I/O latency increased from average value of 7017 microseconds to 283750 microseconds.
 2013-11-12T15:02:57.867Z cpu11:14711)ScsiDeviceIO: 1191: Device naa.60060160f192280016a44f415d09e311 performance has improved. I/O latency reduced from 33289 microseconds to 6550 microseconds.
 2013-11-12T15:03:01.143Z cpu14:12738)WARNING: ScsiDeviceIO: 1211: Device naa.6006016027402b00da38014a0afbe211 performance has deteriorated. I/O latency increased from average value of 3523 microseconds to 71287 microseconds.
 2013-11-12T15:03:02.369Z cpu15:8207)WARNING: ScsiDeviceIO: 1211: Device naa.6006016027402b00da38014a0afbe211 performance has deteriorated. I/O latency increased from average value of 3640 microseconds to 77340 microseconds.
 2013-11-12T15:03:05.210Z cpu7:19276)WARNING: ScsiDeviceIO: 1211: Device naa.6006016027402b007ae86e5393afe111 performance has deteriorated. I/O latency increased from average value of 8083 microseconds to 165025 microseconds.
 2013-11-12T15:03:10.521Z cpu9:11775)WARNING: ScsiDeviceIO: 1211: Device naa.60060160f19228005c4f40abf709e311 performance has deteriorated. I/O latency increased from average value of 1650 microseconds to 38040 microseconds.
 2013-11-12T15:03:14.402Z cpu5:19284)WARNING: ScsiDeviceIO: 1211: Device naa.6006016027402b009eb39a099d61e111 performance has deteriorated. I/O latency increased from average value of 7235 microseconds to 144865 microseconds.
 2013-11-12T15:03:19.355Z cpu7:166729)WARNING: ScsiDeviceIO: 1211: Device naa.6006016027402b009eb39a099d61e111 performance has deteriorated. I/O latency increased from average value of 7254 microseconds to 162677 microseconds.
 2013-11-12T15:03:20.669Z cpu7:8317)WARNING: CpuSched: 7827: 50 worlds are woken up in one call, event= 72017028079320
 2013-11-12T15:03:22.106Z cpu7:8317)WARNING: CpuSched: 7827: 51 worlds are woken up in one call, event= 72017028079320
 2013-11-12T15:03:26.635Z cpu4:17422)WARNING: ScsiDeviceIO: 1211: Device naa.60060160f1922800b8e5f7511a0ae311 performance has deteriorated. I/O latency increased from average value of 2374 microseconds to 49160 microseconds.
 2013-11-12T15:03:32.047Z cpu3:148981)WARNING: ScsiDeviceIO: 1211: Device naa.60060160f192280016a44f415d09e311 performance has deteriorated. I/O latency increased from average value of 1694 microseconds to 35121 microseconds.
 2013-11-12T15:03:36.475Z cpu15:8207)WARNING: ScsiDeviceIO: 1211: Device naa.6006016027402b00da38014a0afbe211 performance has deteriorated. I/O latency increased from average value of 3927 microseconds to 113732 microseconds.
 2013-11-12T15:03:40.591Z cpu13:8317)WARNING: CpuSched: 7827: 52 worlds are woken up in one call, event= 72017028079320
 2013-11-12T15:03:45.351Z cpu4:148982)WARNING: ScsiDeviceIO: 1211: Device naa.60060160f192280012297f8c9f6fdf11 performance has deteriorated. I/O latency increased from average value of 3176 microseconds to 65316 microseconds.
 2013-11-12T15:03:46.100Z cpu14:12014)NetPort: 1574: disabled port 0x3000010
 2013-11-12T15:03:46.120Z cpu0:12014)NetPort: 2747: resuming traffic on DV port 2954
 2013-11-12T15:03:46.120Z cpu0:12014)NetPort: 1380: enabled port 0x3000010 with mac 00:00:00:00:00:70
 2013-11-12T15:03:52.947Z cpu7:14719)WARNING: ScsiDeviceIO: 1211: Device naa.60060160ef922800f62652b123b7df11 performance has deteriorated. I/O latency increased from average value of 3320 microseconds to 66653 microseconds.
 2013-11-12T15:03:54.427Z cpu3:176671)ScsiDeviceIO: 1191: Device naa.6006016027402b0072fbde1d4d09e311 performance has improved. I/O latency reduced from 433102 microseconds to 86110 microseconds.
 2013-11-12T15:03:55.785Z cpu7:13899)WARNING: ScsiDeviceIO: 1211: Device naa.60060160f192280012297f8c9f6fdf11 performance has deteriorated. I/O latency increased from average value of 3280 microseconds to 92484 microseconds.
 2013-11-12T15:03:55.879Z cpu4:149947)WARNING: ScsiDeviceIO: 1211: Device naa.6006016027402b0072fbde1d4d09e311 performance has deteriorated. I/O latency increased from average value of 4326 microseconds to 87072 microseconds.
 2013-11-12T15:03:57.618Z cpu4:30242)WARNING: ScsiDeviceIO: 1211: Device naa.60060160f19228005c4f40abf709e311 performance has deteriorated. I/O latency increased from average value of 1687 microseconds to 76918 microseconds.
 2013-11-12T15:04:02.120Z cpu15:8317)WARNING: CpuSched: 7827: 53 worlds are woken up in one call, event= 72017028079320
 2013-11-12T15:04:09.316Z cpu6:148982)WARNING: ScsiDeviceIO: 1211: Device naa.60060160f1922800c2a7d9ba300ae311 performance has deteriorated. I/O latency increased from average value of 3830 microseconds to 76909 microseconds.
 2013-11-12T15:04:09.317Z cpu10:12749)WARNING: ScsiDeviceIO: 1211: Device naa.60060160f1922800c8be27d81b0ae311 performance has deteriorated. I/O latency increased from average value of 1445 microseconds to 30345 microseconds.
 2013-11-12T15:04:09.333Z cpu6:167050)WARNING: P2MCache: vm 167050: 906: failed to Inc PinCount for PPN 0x9117
 2013-11-12T15:04:11.249Z cpu15:8207)WARNING: ScsiDeviceIO: 1211: Device naa.60060160ef922800f62652b123b7df11 performance has deteriorated. I/O latency increased from average value of 3398 microseconds to 82986 microseconds.
 2013-11-12T15:04:16.409Z cpu7:132724)WARNING: ScsiDeviceIO: 1211: Device naa.60060160f1922800c2a7d9ba300ae311 performance has deteriorated. I/O latency increased from average value of 3846 microseconds to 83404 microseconds.
 2013-11-12T15:04:25.830Z cpu14:199438)WARNING: ScsiDeviceIO: 1211: Device naa.60060160f1922800c8be27d81b0ae311 performance has deteriorated. I/O latency increased from average value of 1467 microseconds to 60995 microseconds.
 2013-11-12T15:04:26.065Z cpu8:17420)WARNING: ScsiDeviceIO: 1211: Device naa.6006016027402b0072fbde1d4d09e311 performance has deteriorated. I/O latency increased from average value of 4369 microseconds to 117729 microseconds.
 2013-11-12T15:04:29.682Z cpu10:17434)WARNING: ScsiDeviceIO: 1211: Device naa.60060160f1922800ca02fb92f209e311 performance has deteriorated. I/O latency increased from average value of 2139 microseconds to 46088 microseconds.
 2013-11-12T15:04:34.016Z cpu1:132724)WARNING: ScsiDeviceIO: 1211: Device naa.60060160f1922800ec021d43c10ae311 performance has deteriorated. I/O latency increased from average value of 3381 microseconds to 69214 microseconds.
 2013-11-12T15:04:34.910Z cpu9:8201)WARNING: ScsiDeviceIO: 1211: Device naa.60060160f1922800ec021d43c10ae311 performance has deteriorated. I/O latency increased from average value of 3484 microseconds to 74650 microseconds.
 VMB: 49: mbMagic: 2badb002, mbInfo 0x101070
After quiet a number of weeks dealing with this I noticed something out of the corner of my eye when rebooting a server the dreaded “HP DYNAMIC POWER SAVING MODE” Now this is something i never looked at because they should of all been set to OS control, and under vCenter it was displaying High performance for all host but the ones that were PSODing the properties was grayed out.
Checked all server and changed the ones that were on dynamic power saving mode back to OS control, and have not had a single PSOD since.
It looks like a bug when the C-STATE goes to low it was dropping the storage.
Still completely baffled at how the setting changed as this setting is in the checklist of hand over and I know I had personally set it. but either way its fixed now be removing the power saving options.
*UPDATE*
copied the incorrect storage errors right ones copied up now
Hi Scott,
Your experience is a known issue with HP servers and that power saving feature. See the following KB for details: http://kb.vmware.com/kb/2000091
As for the storage messages you pasted, these are not related to your PSOD. Your storage array is returning a Check Condition, Illegal Request for SCSI command 0x85, which is an ATA Passthru command. The ESX host checks for this across all LUNs every 30 minutes and the EMC VNX/Clariion you have does not support that command. This can safely be ignore. See the following KB for more details: http://kb.vmware.com/kb/1036874
correct a known issue for 5.0 and resolved in current versions. and the PSOD is slightly different. I have replicated this in both 5.1 and 5.5.
thanks for the storage tip, i may have posted the wrong error. will check, right before psod storage freaks out and has completly resolved with the setting change.
Well this is not even storage related. If you look at the backtrace in both of your PSOD screenshots the last entries for one is the e1000 driver (E1000PollRxRing) and the other is NHCCancel, which is part of the HealthCheck code. The E1000 related PSOD is fixed in ESX 5.5 U1 while the NHCCancel PSOD I haven’t even seen before, but it certainly isn’t related to storage.
How many times has the host with the NHCCancel PSOD crashed and is it the same PSOD every single time?
Actually, we have seen the NHCCancel PSOD before but it has been resolved in later ESX builds. The latest release of ESX 5.1 should have the fix.
Hi Nathan, I know ive replied to you outside of this blog but ill just reply here too for the anyone else who come along.
I know the KB http://kb.vmware.com/kb/2000091 is similar and I did see that when trouble shooting but the PSOD is different slightly and since the environment was well over 18 months old and I knew the power saving mode was set to OS control so I dismissed it 🙂
I sent you the VMware support ticket number where I supplied the whole support bundle and was told it was storage, I thought it was storage but some how along the lines the power setting had changed on scattered hosts through the environment and once changed have not had an issue since
So let’s go thru the messages you pasted:
2013-11-12T14:56:46.081Z cpu13:8341)WARNING: vmw_psp_rr: psp_rrSelectPathToActivate:1049:Could not select path for device “naa.6006016027402b0048cc26b7ffece211”.
This was observed for 3 LUNs:
naa.6006016027402b0048cc26b7ffece211
naa.6006016027402b0048b1ef93feece211
naa.6006016027402b00eca593aafeece211
The reason vmw_psp_rr or the Round Roubin PSP is not able to select a path to use is likely because these LUNs have been unpresented to the ESX host at some point in the past. This log snippet from the vmkernel log does not go back far enough for me to give you a date and time of when this LUN disappeared. Regardless, this is not related to your PSOD.
The next set of messages are:
2013-11-12T14:57:01.331Z cpu13:8601)BC: 3115: Blocking due to no free buffers. nDirty = 111 nWaiters = 1
2013-11-12T15:01:41.207Z cpu4:8601)BC: 3115: Blocking due to no free buffers. nDirty = 26 nWaiters = 1
The “Blocking due to no free buffers” message indicates a Buffer Cache exhaustion problem however we can see the nDirty value drop from 111 to 26 so it is flushing properly. This is not related to the PSOD either however if you experience continued issues with buffer cache exhaustion then you can tweak some of the values: http://kb.vmware.com/kb/2052302
In between the buffer cache messages there is a message that I will quickly address:
2013-11-12T15:01:01.613Z cpu13:201200)LinBlock: LinuxBlockCompleteCommand:857: This message has repeated 896 times: Command 0x9e (0x412403fc1f80) failed H:0x0 D:0x2
This is SCSI command 0x9e failing, which is the Service Action In command that EMC uses in conjunction with the VAAI primitives. This command is failing due to a Check Condition being returned by the array. Unfortunately I cannot tell you for what device this happened to nor the Sense Data because it has been truncated. Still not relevant to the PSOD.
Next we see a flurry of “performance has deteriorated” messages to numerous LUNs:
2013-11-12T15:02:11.501Z cpu4:20421)WARNING: ScsiDeviceIO: 1211: Device naa.6006016027402b000cbdccfc4c09e311 performance has deteriorated. I/O latency increased from average value of 3457 microseconds to 89031 microseconds.
This is just a single example but it shows that the average I/O latency jumped from 3.4ms to 89ms. This is the round trip time for a SCSI command once it has left the HBA hit the array and return completed. As far as the initiator on this host is concerned, it definitely saw an increase in latency to the EMC array. This is true for a number of LUNs. If general latency has actually increased to the EMC array then this can be verified by searching for these same log messages on other hosts for the same time period. If all hosts are reporting increased latency regularly then you may want to explore this further with EMC or your storage team. EMC will likely ask you to collect NAR data from the array which capture performance metric at a more granular level.
Amongst these performance deteriorated messages we also see different kind of warning message: “worlds are woken up in one call”
2013-11-12T15:03:20.669Z cpu7:8317)WARNING: CpuSched: 7827: 50 worlds are woken up in one call, event= 72017028079320
2013-11-12T15:03:22.106Z cpu7:8317)WARNING: CpuSched: 7827: 51 worlds are woken up in one call, event= 72017028079320
2013-11-12T15:04:02.120Z cpu15:8317)WARNING: CpuSched: 7827: 53 worlds are woken up in one call, event= 72017028079320
These messages are harmless. In fact they have been suppressed in new ESX builds.
Lastly there is another message amongst the performance deteriorated messages:
2013-11-12T15:04:09.333Z cpu6:167050)WARNING: P2MCache: vm 167050: 906: failed to Inc PinCount for PPN 0x9117
This is also a harmless message. It indicates that vm 167050 had to retry an I/O since the previous one had failed due to memory overcommit. Since there was only a single instance of this message instead of a flood, it can safely be ignored.
In the end, none of the messages that were occurring directly before the PSOD seems to be related. If changing the Power Management options in the BIOS has produced stability then it seems to reason that these are related. While the original KB I provided you stated that a certain behavior is fixed in 5.1 it is possible the same issue is manifesting itself in different ways or there is a code regression. A note in the KB also states to update the server BIOS to the latest release since a permanent fix would be made there and not in an advanced setting in our code.