VMware vCenter Operation manager is a great tool but it can take a bit of work to get all the information you require to do your job on a single screen. Out of the box I can create a heat map for space utilisation for all data stores in the environment. But because of the child parent relationships I can not have a heat map with just datastores from cluster A or all datastores from Host b.
Using groups in vCOPS is one way to get around this.
In the normal vSphere view of vCOPS on the top left there will be 3 icons (Hosts, Groups and Datastores) Select groups and click on Actions drop down and select create new.

You will then be prompted for the group name and details, This is pretty straight forward. You definatly want to update group automatically so you dont need to touch it constantly

Next we need to define the group membership. I am using an exisitng group Ive created for a client of mine, Copy what I have entered below, Select desendant of equals then enter the exact name of the cluster or host you wish to have.
Add another criteria and select object type equals datastore.

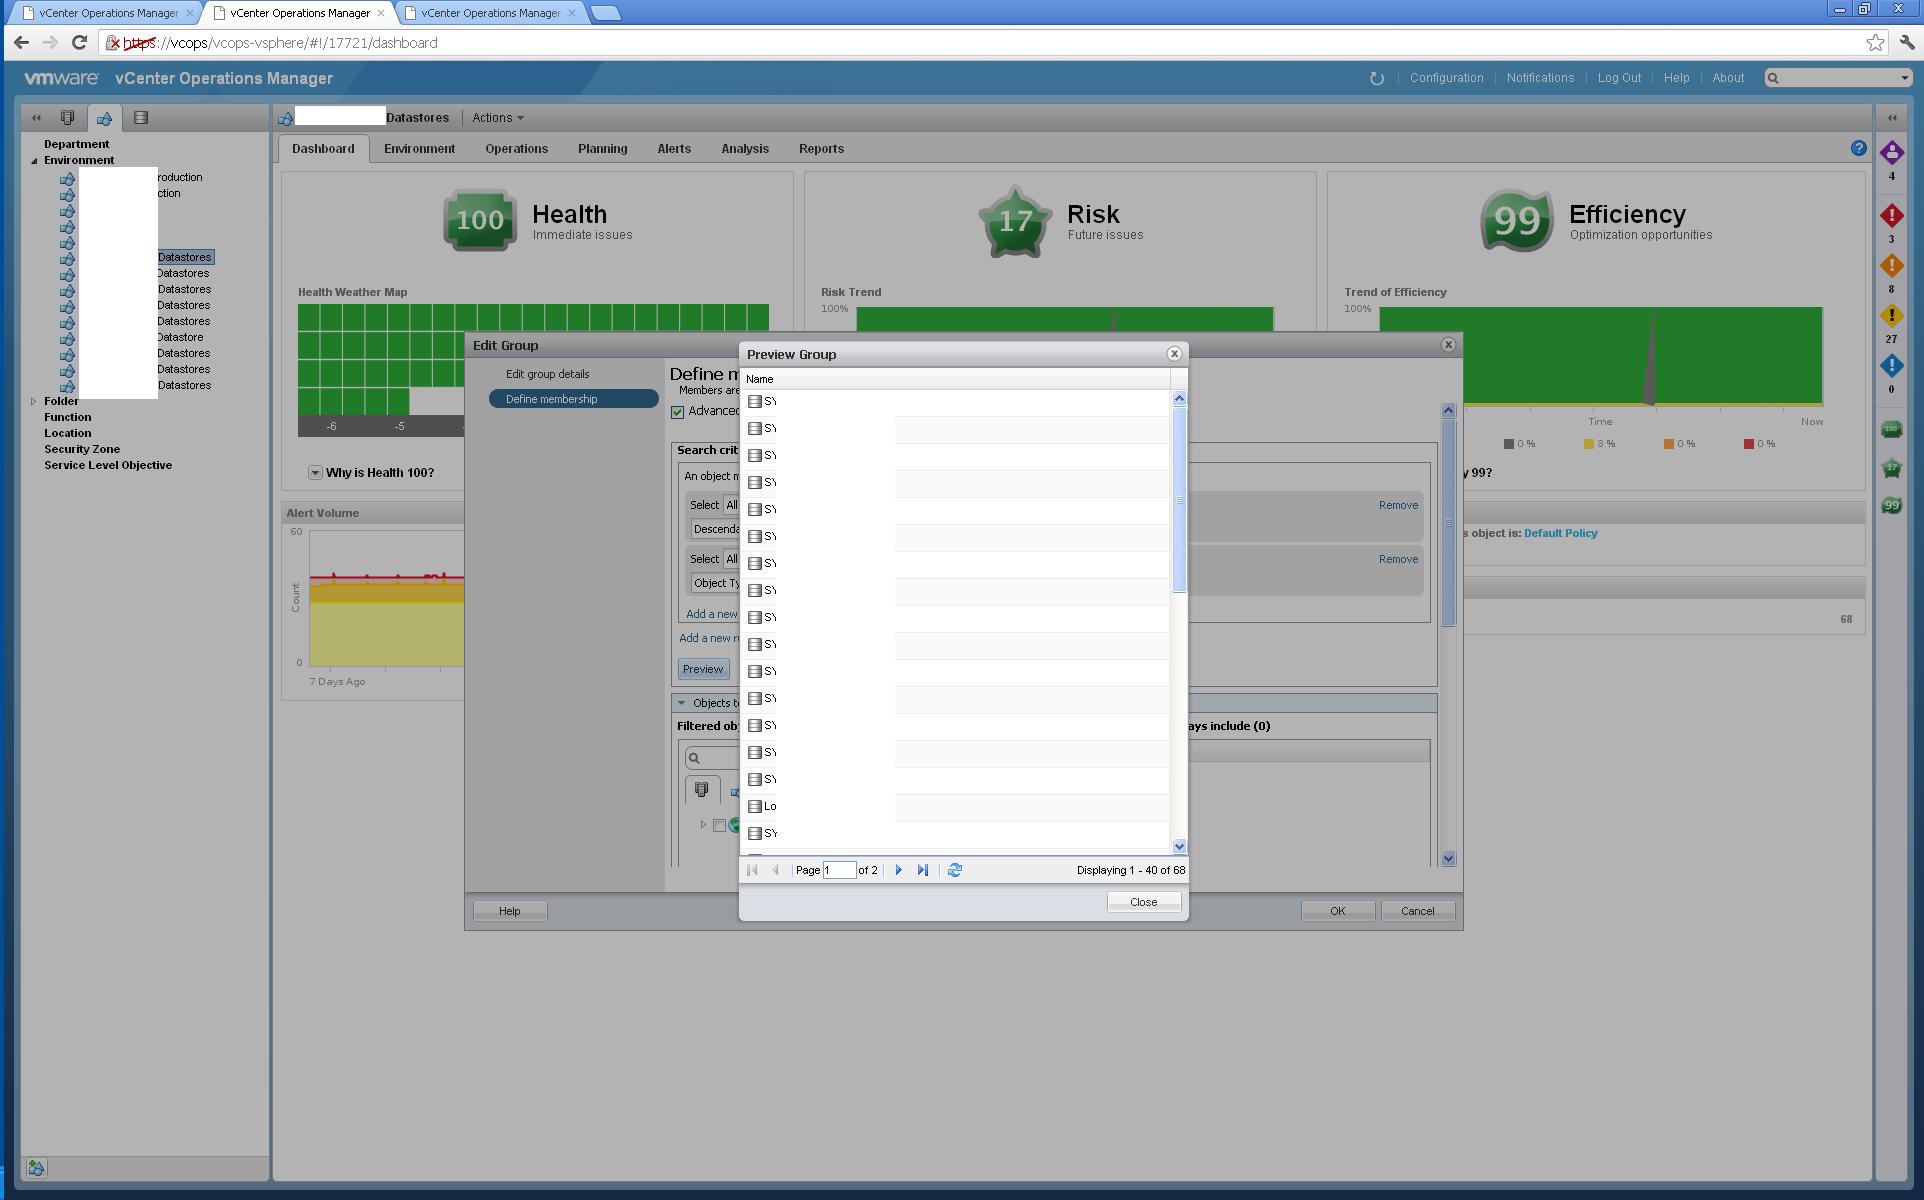
If you want to make sure that everything is correct hit the preview button and this will show you what will be in the group.
Now its time to log into the custom UI, in the environment menu select super metrics and create a new metric. More details on this are in a previous post of mine HERE.
In the resource section search for a datastore, can be any datastore, Once selected find the capacity metrics and use the operation I have used below. when selecting the metric make sure you have THIS selected at the top, this ensures the function you create will work on any datastore resource. Other wise it is tied directly to the datastore you have picked.

Once the function is complete hit ok. Now you will need to add this super metric to a Package. Please see this POST for those details.
Next we want to associate the new super metric and package to a resource, note if you already have existing package for datastores then this does not need to be done. Go to the environment menu and configuration and then select RESOURCE KIND DEFAULT. Select Datastore and choose the new super metric package you have added the super metric too.

By doing this any future datastores will automatically be covered by this package but no existing ones will be so we need to add these in.
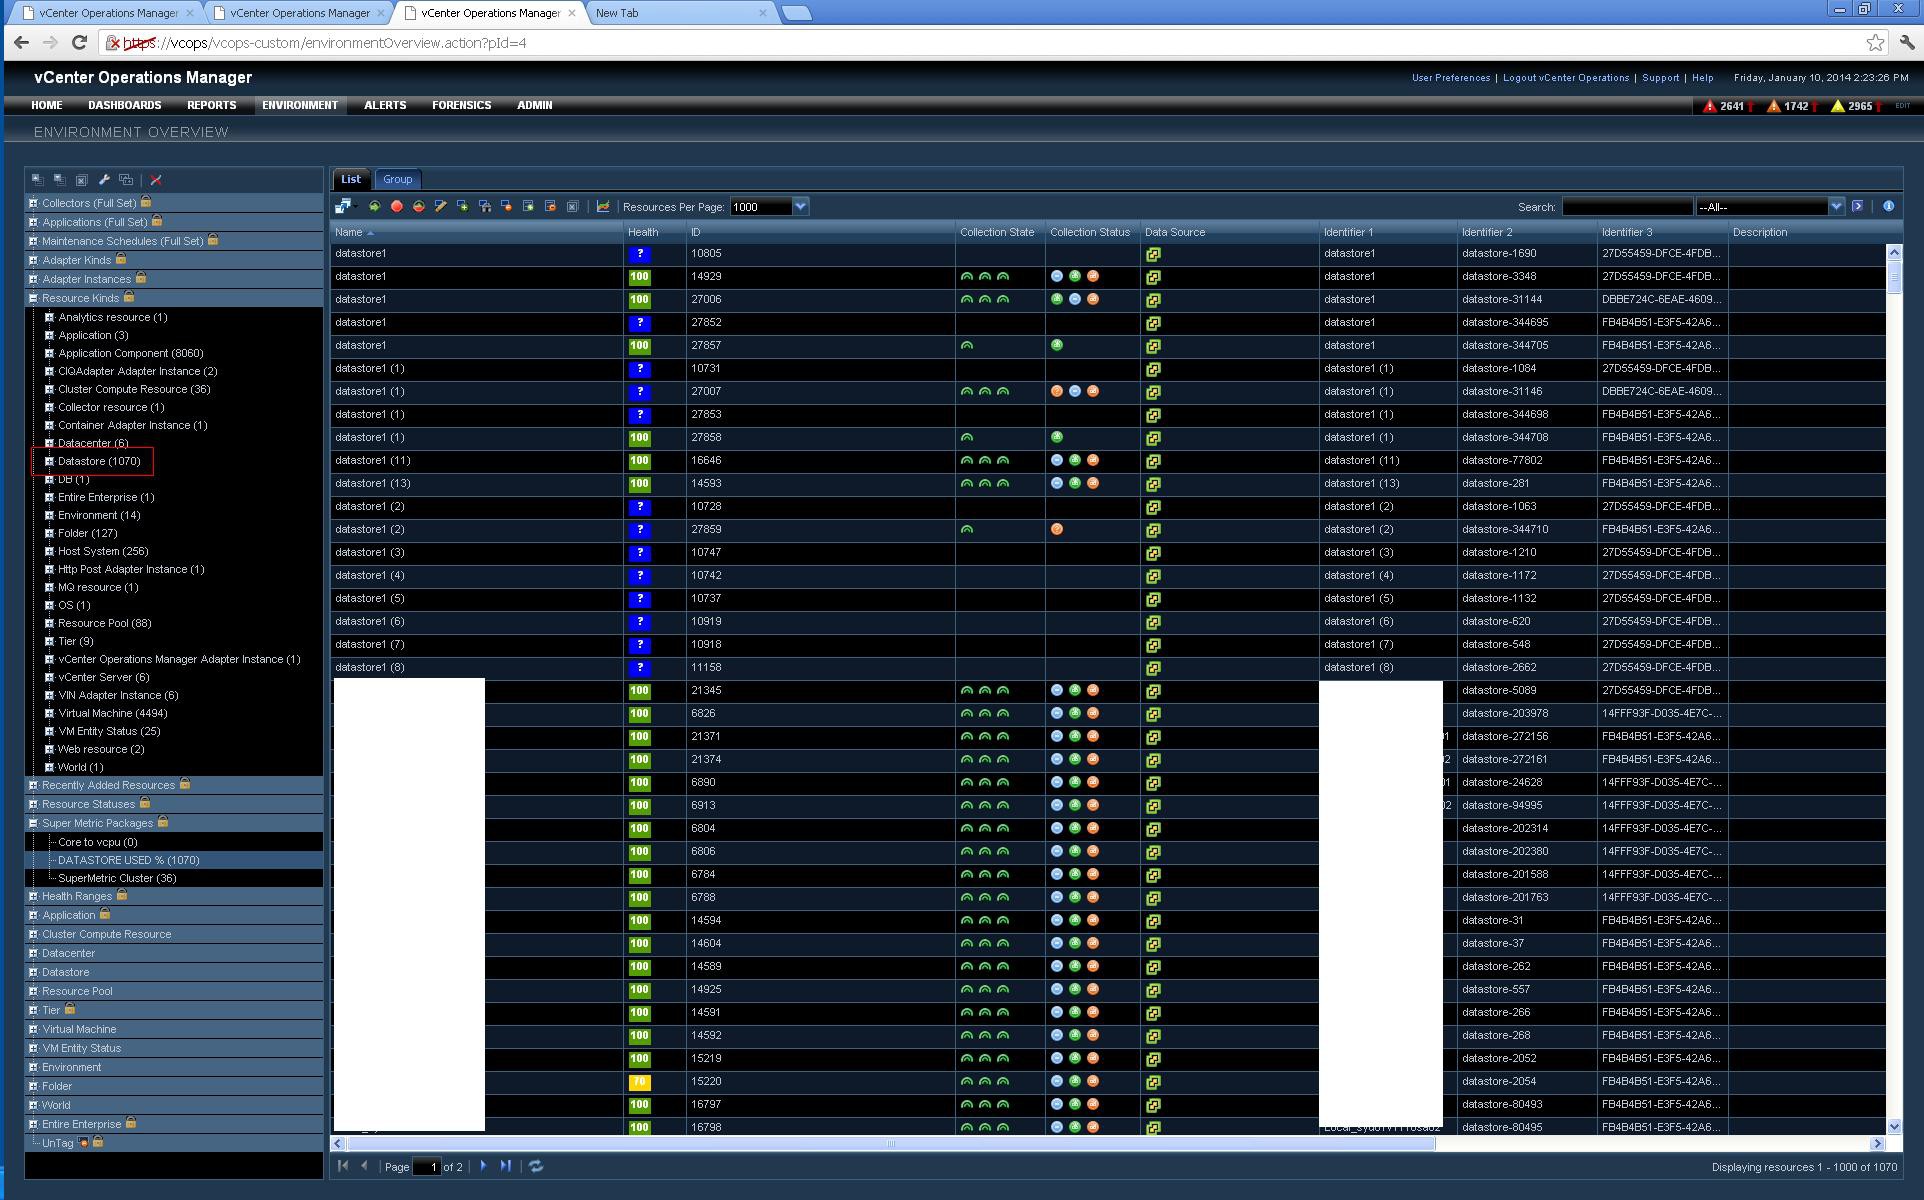
Do this by selecting environment menu and select ENVIRONMENT OVERVIEW. Find you super metric package and drag and drop all datastores into it or add them in manually, Note if you have a package already assigned to datastores than this can be skipped.
Next we add a heat map widget to a dashboard, Use the settings I have selected below. Group by the resource (host or cluster), Resource kid as datastores then under the tags part at the bottom select the group you originally created in the normal vSphere UI. Then we want to color by the super metric we created.

This will then give you an at a glance idea of your storage utilisation and will tell you if any are at the 10% threshold or any threshold you choose by changing the colors.
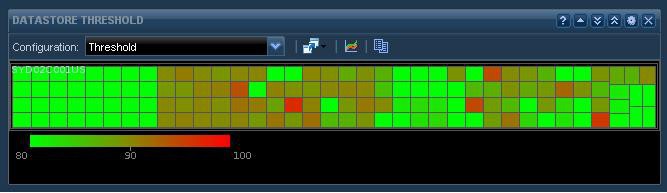

[…] Datastore Threshold Heat Map Widget – Please see a previous post At a glance datastore usage by cluster or host for custom dashboards this is how this widget is […]
Great blog you’ve got here.. It’s difficult to find
excellent writing like yours these days. I truly appreciate individuals like
you! Take care!!
Thanks so much for your feed back, it really means allot. happy to see others getting use from my blog.
I want to pull the information, data-store highest latency past 3 months in my vm infra.. i have 580 datastores in my vm infra..i am using vcops 5.8.2. i how to troubleshoot why the datastore is in high latancy .. kindly help
There is a number of ways to troubleshoot, The first is to look at ESXTOP on the ESXi host, and have a look where the latency is, if its in the kernel or device, Once you know where the issue maybe then you can look down that path
thanks for your info and reply